
Blooming
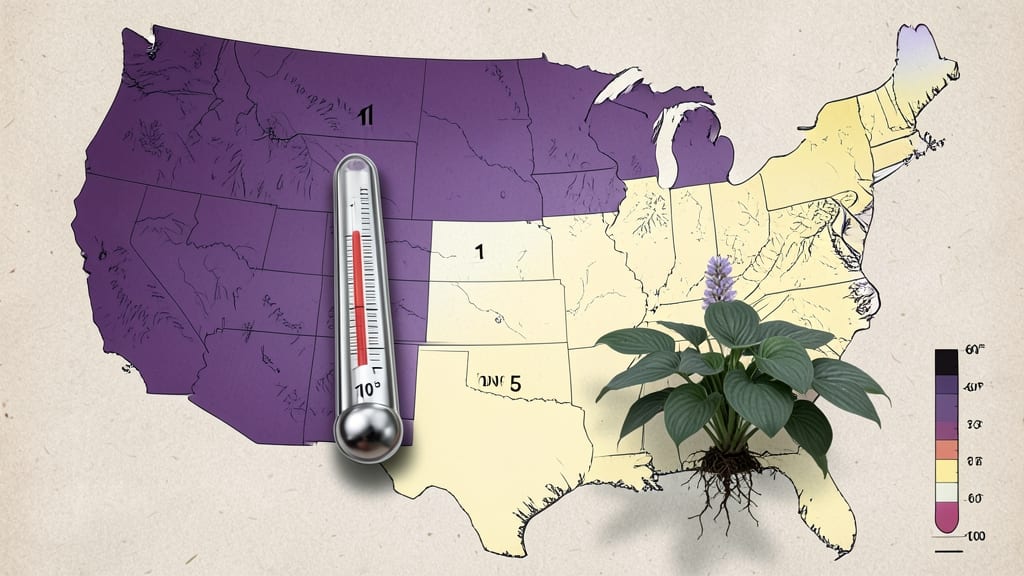
The USDA Plant Hardiness Zone Map organizes the U.S. into 13 official climate zones, numbered 1 (Alaska) to 13 (Florida), based on average winter lows. Each zone is further divided into 'a' and 'b' subcategories to help gardeners pinpoint exact growing conditions.
The USDA Plant Hardiness Zone Map isn't just about numbers—it's a gardener's GPS for success. 🌱 These zones reflect the average annual minimum temperatures over 30 years, helping you match plants to your local climate with precision.
For example, Zone 5 (common in the Midwest) can handle plants that survive down to -20°F, while Zone 9 (Southern California) thrives with plants that need only 20°F protection. Knowing your zone means avoiding costly mistakes like planting tropical hibiscus in Minnesota or freezing-sensitive tomatoes in Maine.
What's fascinating is how these zones shift over time. Climate change has already pushed some regions into warmer zones—like parts of the Northeast moving from Zone 5b to 6a in just decades.
That's why gardeners should check the updated map every few years, especially if they're planning long-term landscapes or experimenting with new plant varieties.
💡 In This Article
- How USDA Plant Hardiness Zones Are Calculated
- How to Find and Use Your USDA Zone for Gardening
How USDA plant hardiness zones are calculated
The USDA Plant Hardiness Zone Map relies on 30 years of historical temperature data collected from thousands of weather stations across the U.S. Scientists analyze the average annual minimum temperatures—the coldest temperatures expected to occur in 7 out of 10 years.
This 30-year baseline accounts for natural climate variability, ensuring zones remain stable for gardeners planning long-term landscapes. For instance, Zone 6a (where Chicago resides) has an average minimum of -10°F to -5°F, while Zone 10a (Southern Florida) stays above 30°F.
Geographic factors like elevation and proximity to large bodies of water introduce local adjustments. Mountains create microclimates where zones shift dramatically over short distances—ever notice how Denver (Zone 5b) feels colder than nearby lower-elevation areas?
Water bodies moderate temperatures, making coastal regions like Seattle (Zone 8b) milder than inland areas at similar latitudes. The USDA accounts for these variations by overlaying topographic data with temperature records, creating a nuanced map that reflects real-world growing conditions.
Climate change complicates zone calculations. Since the 1990s, rising global temperatures have shifted some regions into warmer zones—parts of New York once classified as Zone 5b now align with Zone 6a. The USDA updates the map every 10 years (most recently in 2023) to reflect these changes.
This recalibration helps gardeners adapt to new growing realities, like successfully cultivating Zone 8 plants (like bougainvillea) in areas that were previously too cold.
Here’s how the system works in practice: Each zone spans a 10°F range, with 'a' subzones representing the warmer half and 'b' the colder half. For example, Zone 7a ranges from 0°F to 10°F, while 7b spans 10°F to 20°F.
This precision matters because a 5°F difference can mean the difference between a plant surviving or succumbing to frost. Gardeners in Zone 7b can grow camellias (hardy to 10°F), but those in 7a must choose more cold-resistant varieties like serviceberry (hardy to 0°F).
The USDA also considers urban heat islands—cities like Phoenix (Zone 9b) can be 5-10°F warmer than surrounding rural areas, creating localized growing opportunities. This is why gardeners in urban centers often find they can push zone limits slightly higher than official maps suggest.
The key takeaway? While the map provides a solid foundation, real-world conditions—like microclimates and urban warmth—often require personal adjustments to maximize garden success.
For those curious about the science, the USDA collaborates with NOAA (National Oceanic and Atmospheric Administration) to refine temperature models. They use degree-day accumulation (a measure of heat energy) to predict plant growth cycles, ensuring zones align with both survival limits and optimal growing conditions.
This level of detail transforms the zone map from a simple guide into a precision tool for gardeners nationwide.