
How To
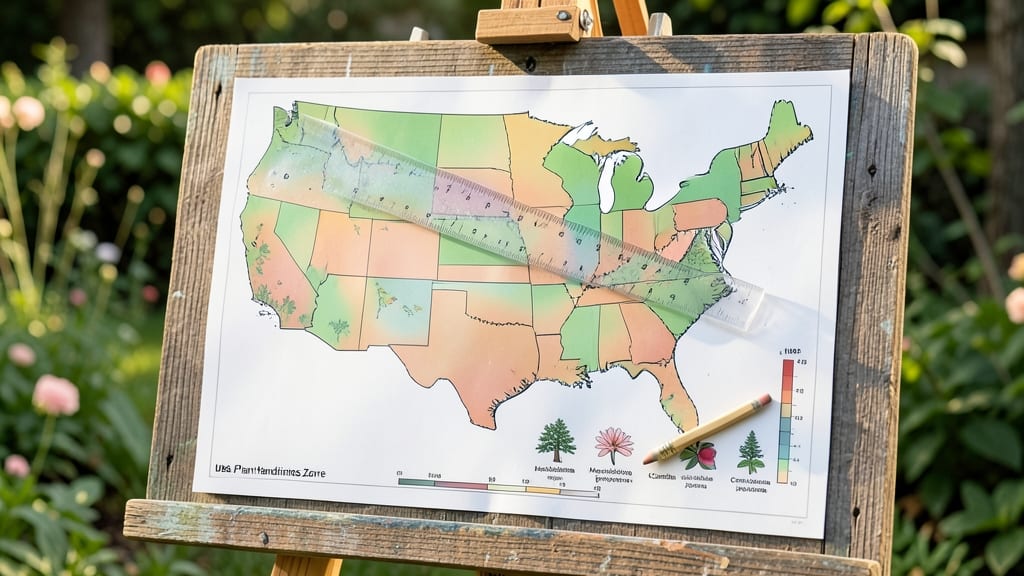
A map of US planting zones divides the country into 13 hardiness zones (1-13) based on average minimum winter temperatures, helping gardeners select plants that thrive in their local climate. Use the USDA Plant Hardiness Zone Map to locate your zone by ZIP code, city, or latitude/longitude for optimal planting success.
A map of US planting zones serves as your gardening GPS, revealing which plants can survive your area's coldest winters. 🌱 The zones range from Zone 1 (Alaska) to Zone 13 (Florida/Hawaii), with each zone representing a 10°F temperature range—so Zone 5 (-15°F to -5°F) is colder than Zone 8 (10°F to 20°F).
This system, updated by the USDA every 10 years, accounts for long-term climate data to help you avoid costly mistakes like planting tender citrus in Minnesota or frost-sensitive tomatoes in northern Maine.
Why this matters? Plants have specific cold tolerance thresholds—knowing your zone means you can choose varieties that won't wilt or freeze.
For example, zone 6 gardeners can grow peonies (hardy to -20°F) but should protect roses in winter, while zone 10 gardeners might struggle with traditional lawn grasses and need drought-resistant alternatives.
The map even accounts for microclimates, so your backyard might be Zone 7a while a nearby valley drops into 6b.
💡 In This Article
- How US Planting Zones Determine Plant Survival
- Finding Your Planting Zone: Step-by-Step Guide
How US planting zones determine plant survival
The science behind planting zones revolves around the average annual minimum temperature—the coldest temperature a location typically experiences in a 30-year period. Each zone represents a 10°F range, with Zone 1 enduring -60°F to -50°F (like Alaska) and Zone 13 facing 60°F to 70°F (like Hawaii).
This range directly correlates with a plant's cold hardiness, measured by its ability to survive freezing temperatures without cellular damage.
Plants have built-in survival mechanisms, like antifreeze proteins in woody perennials (e.g., maples) that prevent ice crystals from forming in cells during winter. However, these adaptations have limits—most garden plants can only tolerate temperatures within their zone's range.
For example, a Zone 5 tomato plant (hardy to -20°F) would die if exposed to Zone 1's -50°F winters, while a Zone 10 citrus tree (hardy to 30°F) would suffer leaf burn in Zone 6's -10°F dips.
The USDA's data accounts for these thresholds by analyzing historical temperature records from weather stations nationwide.
Microclimates add complexity to this system. A south-facing slope might be Zone 7b while a nearby shaded valley drops to 6a—just 5°F colder.
This is why gardeners in Zone 6 can grow hydrangeas (hardy to -25°F) in sunny spots but may need to protect them in frost pockets. Even urban areas create heat islands, pushing zones up by 1-2 degrees compared to rural surroundings.
Understanding these variations helps explain why your neighbor's garden thrives with certain plants while yours struggles.
The zone system also accounts for seasonal frost risks. Plants in Zone 8 (like peaches) might survive 10°F dips but require chilling hours (400-800 hours below 45°F) to bloom properly. Without these cold periods, fruit trees fail to produce.
This is why Zone 10 gardeners often rely on low-chill varieties or use artificial chilling methods for tropical crops. The USDA map's temperature bands help predict these seasonal patterns with surprising accuracy—within ±5°F of actual conditions in most cases.
What most gardeners overlook is how soil temperature interacts with air temperature. Roots often freeze 2-4°F earlier than aboveground plants because soil conducts cold more efficiently.
This is why Zone 6 gardeners might successfully grow winter wheat (hardy to -15°F) but struggle with asparagus crowns, which need soil temps above 32°F to survive. The zone map's air temperature data serves as a baseline, but local soil conditions often require adjustments.
Consider this real-world example: In Zone 7a (where 0°F to 5°F is typical), gardeners can grow crabapples (hardy to -30°F) but must protect camellias (hardy to 10°F) during polar vortex events.
The 5°F difference between these plants' limits explains why some years bring total failure for one species while another thrives. This precision is what makes the zone map an indispensable tool—not just for planting, but for understanding your garden's ecological limits.