
Planting
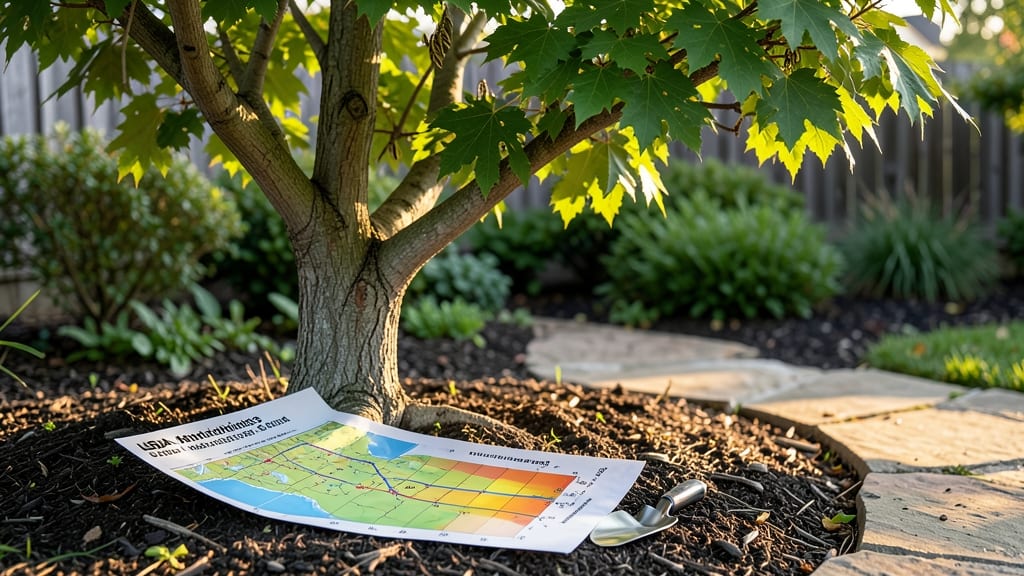
Your plant hardy zone determines which plants will thrive in your area by matching their cold tolerance to your region's average minimum temperatures. Use the USDA Plant Hardiness Zone Map to find your base zone, then adjust for local microclimates that can shift temperature ranges by 3-5 zones.
This system divides the U.S. into 13 zones based on 10°F temperature increments, with Zone 1 being the coldest and Zone 13 the warmest. 🌱 The USDA updates these zones periodically to reflect changing climate patterns, so always check the latest map for your ZIP code.
What's fascinating is how microclimates—like a sunny south-facing wall or a sheltered garden nook—can create pockets where plants might survive one or two zones warmer than the official map suggests.
For accurate planting decisions, I recommend testing your yard's specific conditions over several years. Place a minimum temperature gauge in different areas to track how cold it actually gets, and compare it to the USDA's average.
This helps you fine-tune your zone number for optimal plant selection, especially when working with sensitive species like citrus trees or tropical plants.
💡 In This Article
- How USDA Plant Hardiness Zones Are Calculated
- Microclimate Adjustments for Accurate Plant Selection
How USDA plant hardiness zones are calculated
The USDA Plant Hardiness Zone Map relies on 30 years of historical temperature data to determine the average annual minimum temperature for each zone.
Scientists analyze records from weather stations across the country to calculate the coldest temperatures that occur in 7 out of every 10 years—a statistical approach that accounts for natural variability.
This methodology creates zones with 10°F increments, from Zone 1 (-60°F) to Zone 13 (100°F), ensuring precise temperature-based plant matching.
Zone boundaries are drawn using complex algorithms that consider elevation, latitude, and local topography. For example, a mountain slope at 5,000 feet might experience 5-10°F colder temperatures than the valley below, creating natural zone shifts.
The USDA updates these maps every 10 years to reflect climate change—since 1990, many regions have shifted 1-2 zones warmer due to rising global temperatures. This means a plant once considered borderline for your area might now thrive without protection.
The science behind this system is rooted in plant physiology. Most plants enter dormancy when temperatures drop below 32°F, but their cold tolerance varies. Deciduous trees like maples can survive -20°F (Zone 5), while citrus needs 25°F (Zone 9) to avoid damage.
The USDA zones help gardeners match plants to these thresholds, preventing costly mistakes like freezing-sensitive plants in cold climates. 🌡️ What's often overlooked is how microclimates can override these averages—something we'll explore next.
Climate change adds another layer of complexity. Studies show that some regions are warming twice as fast as the global average, which means zone boundaries are shifting faster than the USDA can update them.
For instance, parts of the Midwest that were Zone 5 in 2000 might now function like Zone 6 or 7. This shift benefits warm-climate plants but creates challenges for growers accustomed to traditional zone guidelines.
To stay current, always verify your zone using the official USDA interactive map. Enter your ZIP code to see your base zone, then overlay it with local weather data for a more accurate picture.
For example, a gardener in Zone 6 might find their south-facing garden behaves like Zone 7 due to reflected heat from walls and pavement—a critical adjustment for heat-loving plants like bougainvillea.
Understanding these calculations helps explain why some plants thrive unexpectedly. A zone 8 olive tree might survive winters in Zone 7 if planted against a brick wall, while a zone 5 peony could fail in Zone 6 if exposed to cold winds.
The key is recognizing how your specific conditions modify the official zone designation.